
Direct Assessment Graphs Report
Updated: September 2021
Description: The Direct Assessment Graphs report provides the user with a high-level view of all of their Institution, College, Department or Program outcome sets, disaggregated by Program. When the report is generated, each bar graph representing the outcome achievement can be clicked on to drill down to specific Course and Course Section assessment data for the terms selected in the parameters. This is a very useful report to determine where there are achievement gaps or exceptional performance and pinpoint the source quickly.
Applicable to: Institution Admin, College Admin, Department Admin, Program Coordinator
Assessment Type: Program Assessment Only. Does not apply to Course Learning Outcome assessment not tied to a Program.
Instructions
- Navigate to the Main Menu and find the Analytics section of the menu
- Click Report Dashboard

- Select Direct Assessment Graphs from the Assessment Reports section of the Report Dashboard
- Once accessing this report, select the parameters for the report within Assessment Results Overview
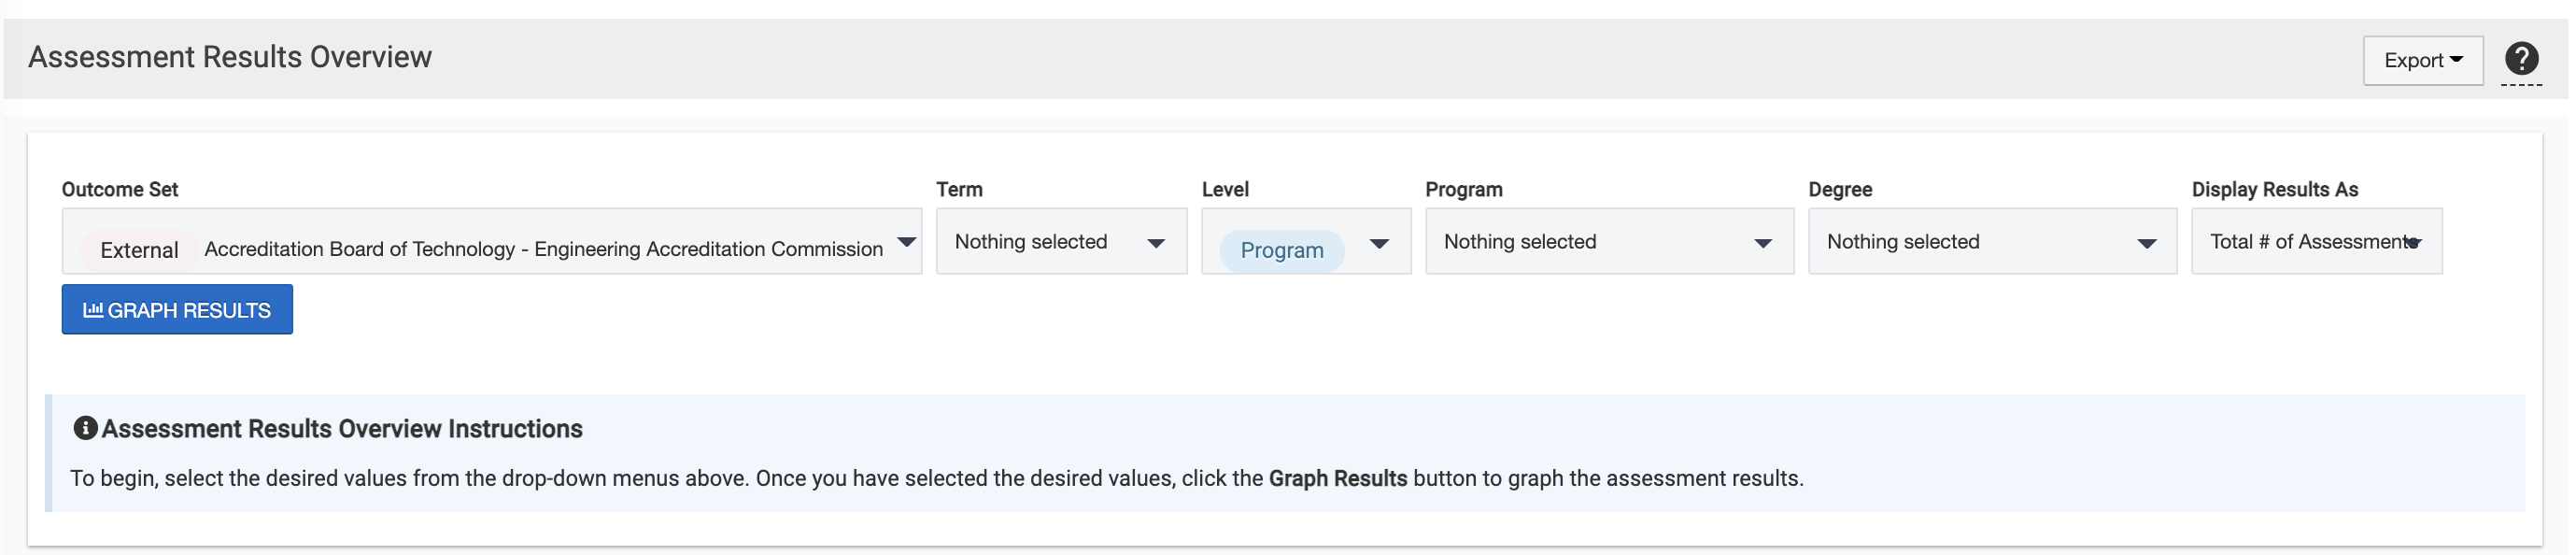
- Outcome Set Dropdown Menu Options – this allows you to select which outcome set results present in the graphs
- External
- Institution
- College
- Department
- Program
- Term
- You may select up to three different terms at the same time
- Level – This sets the aggregation point of the data. If you are looking at an outcome set that is a higher level than Program, you can look at aggregated data at that level – for example looking at Institution outcomes at the College level.
- Institution
- College
- Department
- Program
- Program
- Select the Program you would like to disaggregate your outcome set results by. If you selected a Program outcome set, this will be set to Program by default.
- Degree
- Select student degree/major(s) to disaggregate results. You may multi-select.
- Display Results As
- Total # of Students
- Percentage of Students
- Outcome Set Dropdown Menu Options – this allows you to select which outcome set results present in the graphs
- Click Graph Results once the parameters are set. You may hover over specific parts of the graph for more in-depth data.
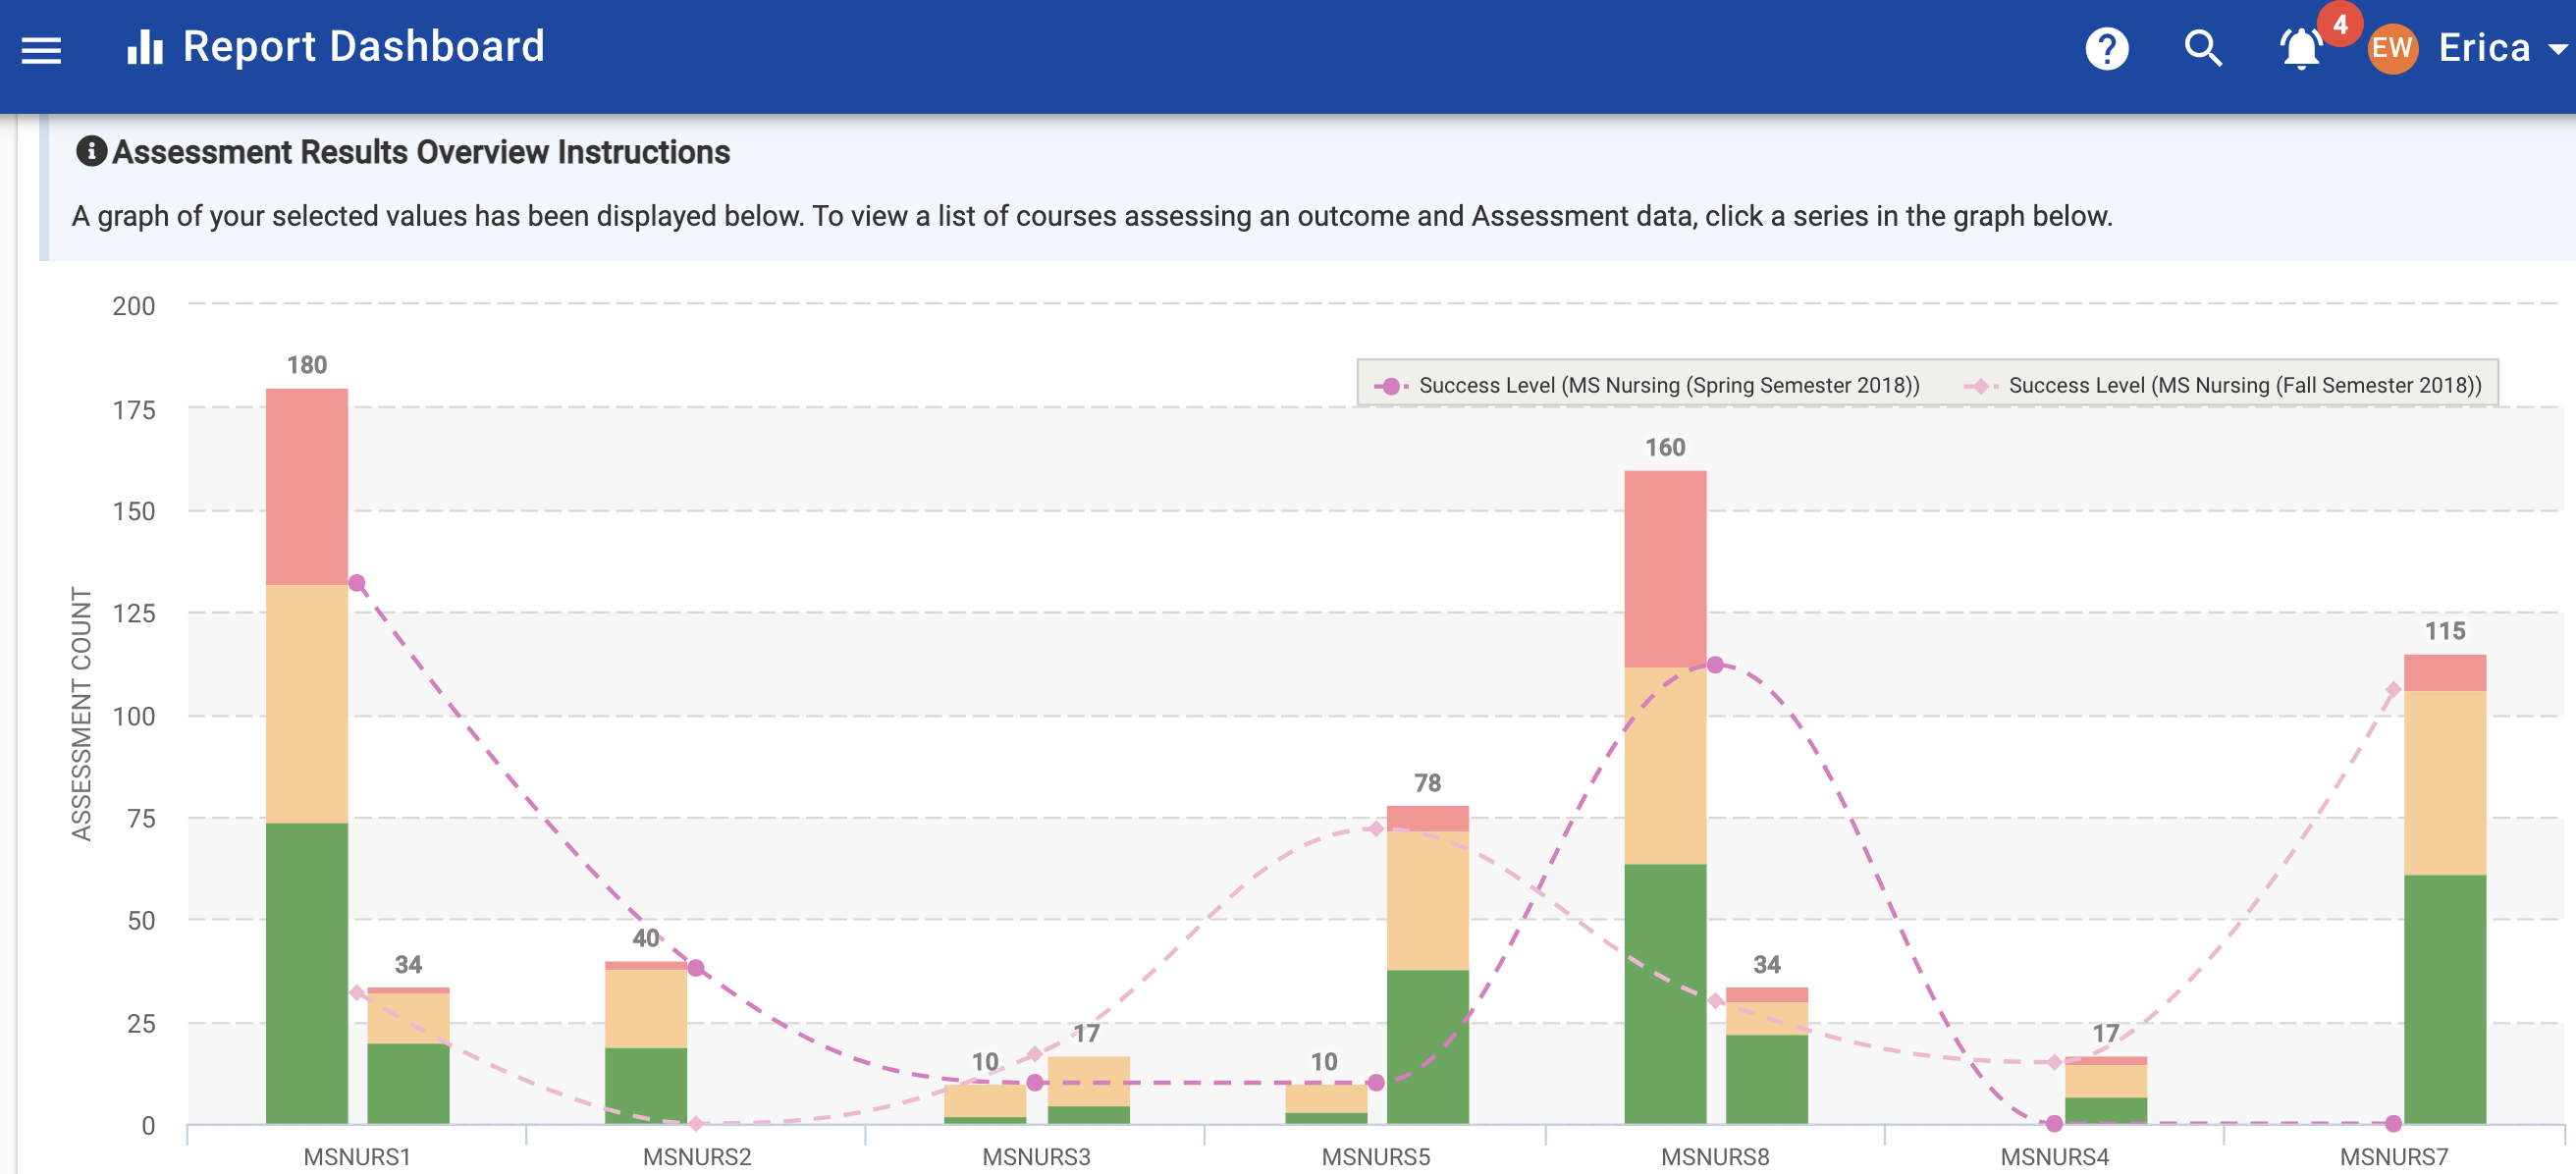
- You can click on the colored bars above each outcome code to see the aggregated Course data that populated into that outcome.
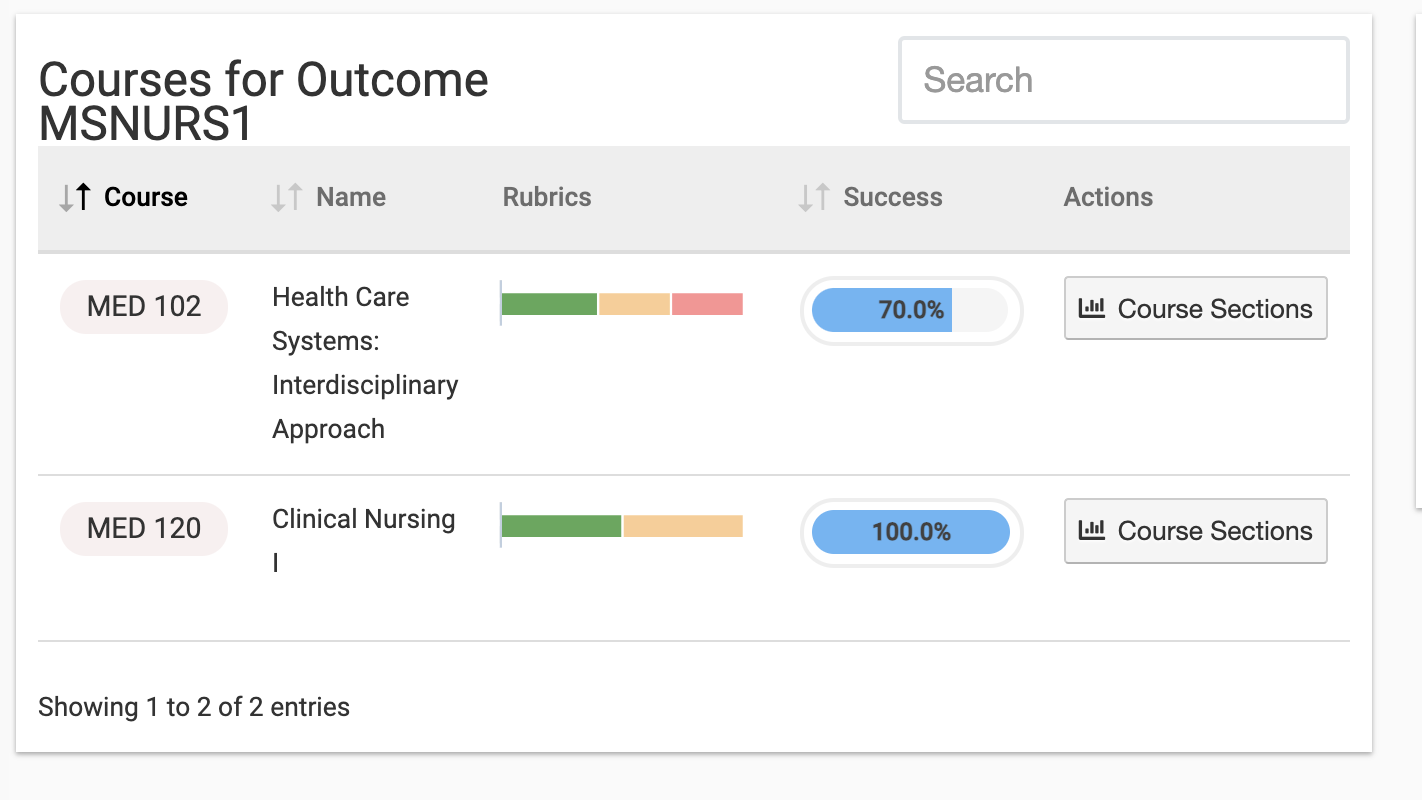
- Then, click on Course Sections to drill down further to see the Course Sections that were assessed and their associated outcome success level.
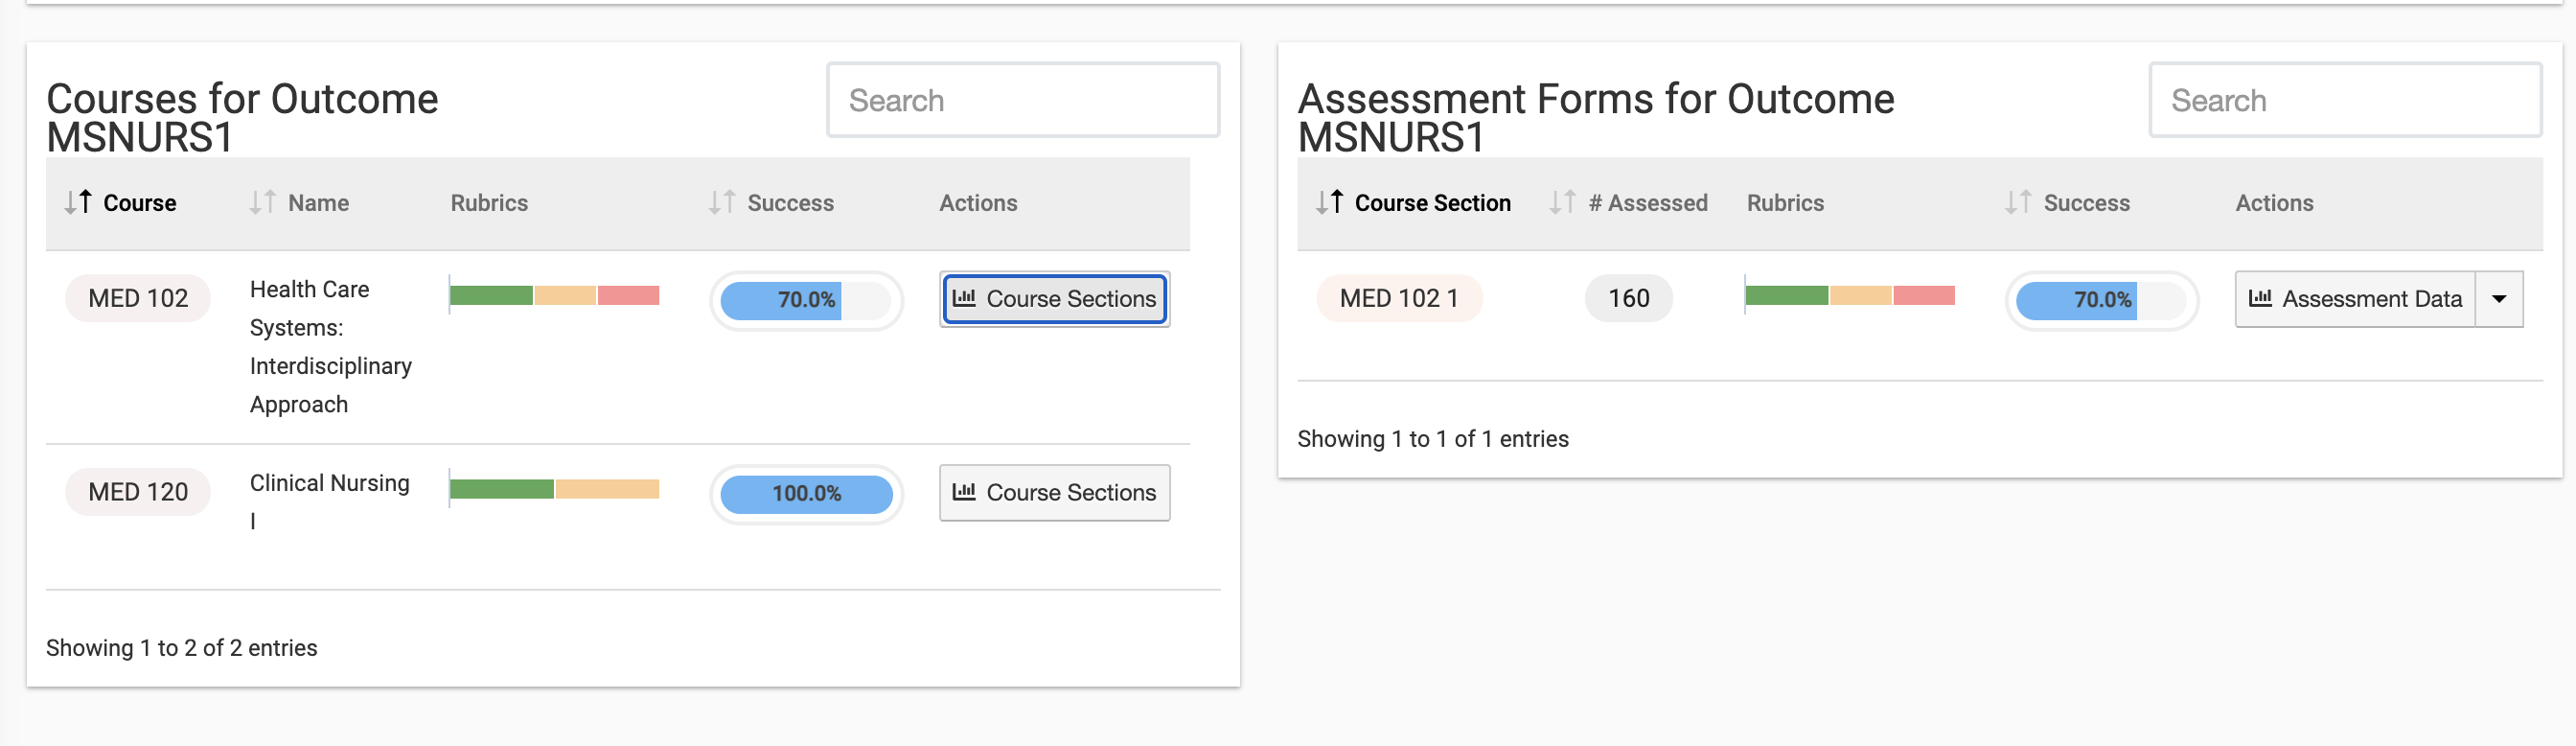
- Finally, to drill down further, select the Assessment Data button next to the section of interest to be directed to the Course Section Assessment Data Reports


Direct Assessment Graphs Report Discussion